
Three Reports. One Clear Picture. Updated Weekly.
Why is it so hard to see who owns a public company?
The Three-Lane View
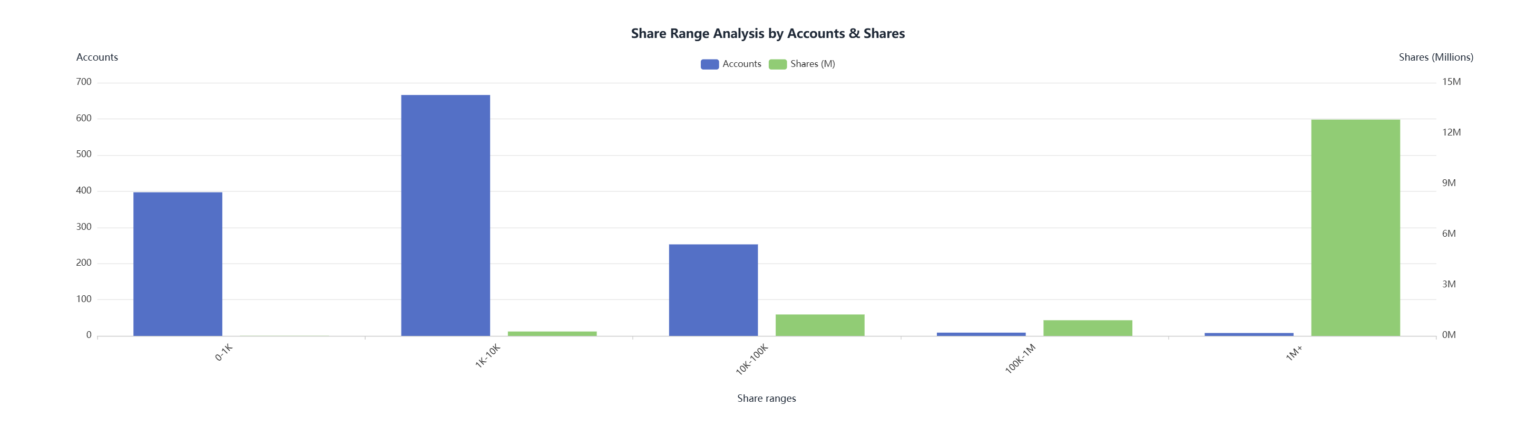
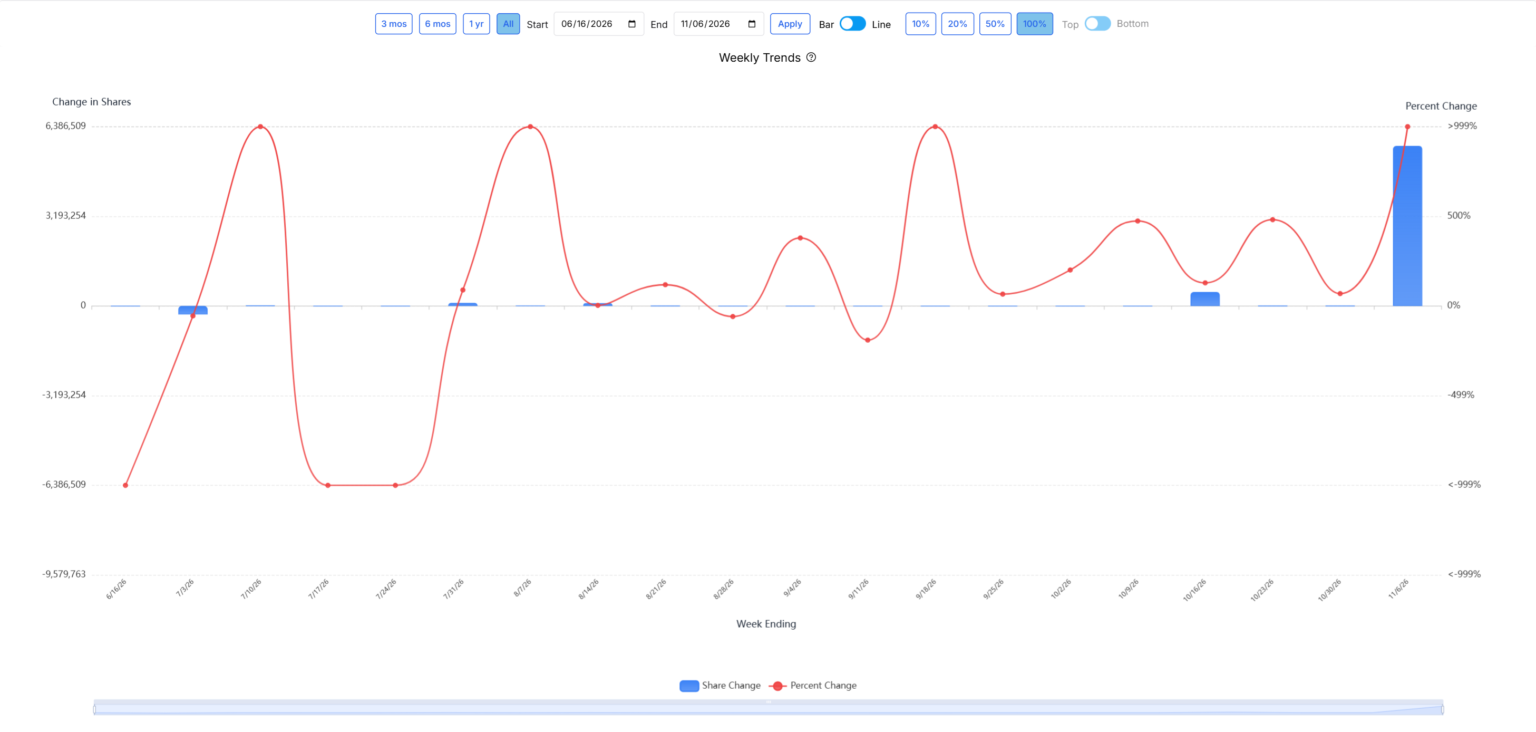
Every week, the truth about your stock. The drops. The steady hands. The active traders. The whales and the small holders.
Registered holders
NOBO holders
Brokers and custodians
From three reports to one call list.
Analyze
Pinpoint
Prioritize
Engage
Everything you need to know your holders.
Shareholder Activity Tracking
Ownership Analytics
Broker and Participant Intelligence
20+ Interactive Views
Position Change Analysis
Geographic Views
Data Export
Enriched Contact Data
Delisting Watchdog threshold alerts, Email Segmentation & Outreach, Deep Demographics with the Sterling Index™
Turn a holder list into people you can reach.
Matching addresses produce personal emails and phones
Do-not-call flags shown right on the record
Determine which stockholders are the best buyers
Hone in on who has the most disposable income
A sample of the fields we match to holder records. Availability varies by holder.
If it doesn’t reconcile, it doesn’t ship.
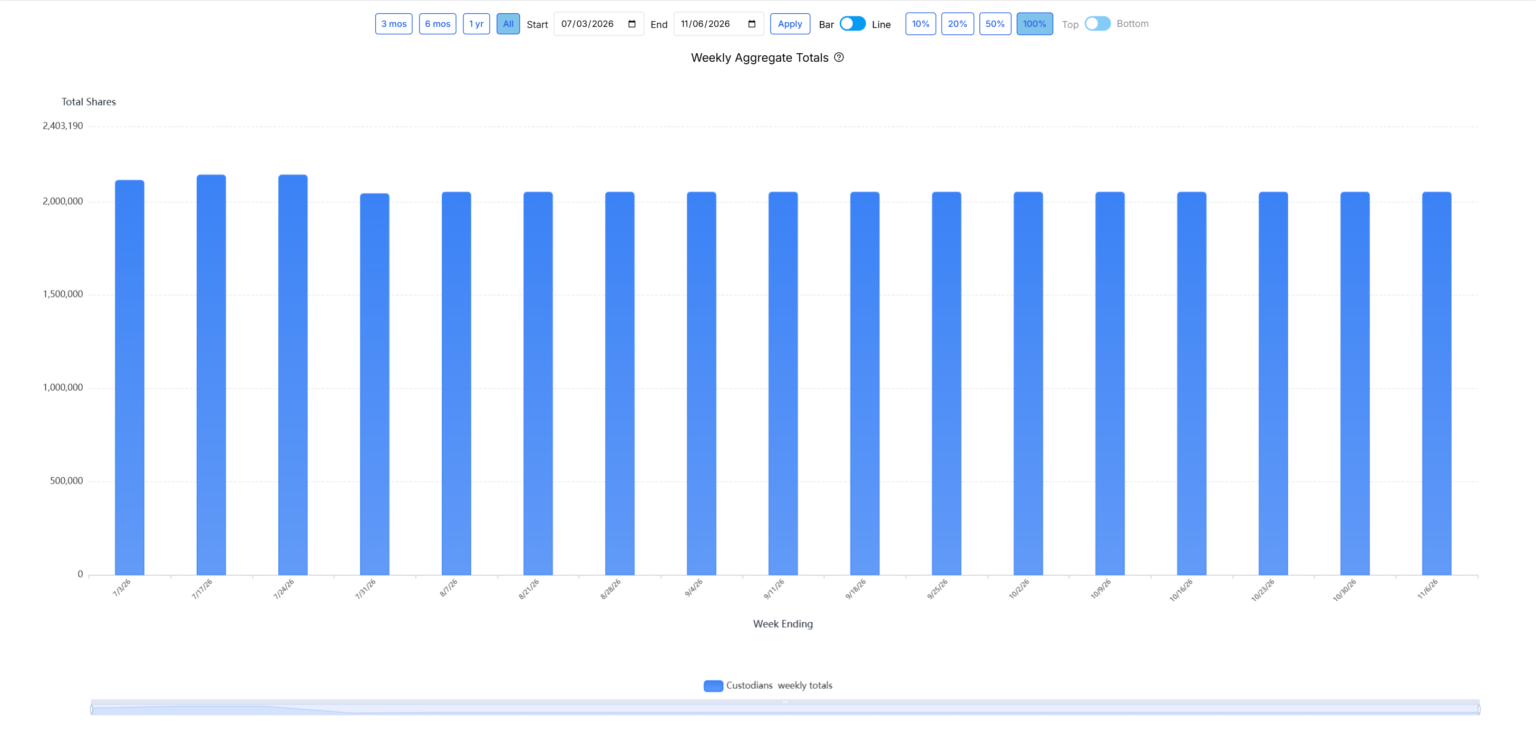
Share counts come from your transfer agent report, so totals reflect issuances and cancellations as your TA reports them.
Positions are kept to two decimals and tie to the TA total.
Transfer agent and NOBO data are never averaged or merged. Every row shows its source.
Every card shows its own “as of” date.
Records we can’t match with confidence go to a review queue. We don’t guess.
Five questions to ask whoever runs your shareholder data today
Can I click a share-range bucket and see the holders in it?
Do your totals tie exactly to my transfer agent report?
Which brokers are new to my stock this period, and which dropped out?
How do I know how current each number is?
Is a move from the transfer agent to a brokerage counted as a sale?
Want the full list? Get all 25 questions